6 Data Curators
We are looking for data curators from our Consortium to help the creation of the CCI Observatory.
Work with governmental or scientific or otherwise open data.
Committed to high policy or business professional standards, and by making their work reproducible, they adhere to reviewability, reproducability, confirmability and auditability, regardless if they work, or study for various professsional roles in business, academia, public or non-governmental policy, and data journalism.
They are interested in helping us with indicator design.
Make the authoritative copy of their indicator available on the Zenodo data repository, and keep it up-to-date with our automated observatory’s help.
An important aspect of the EU Datathon Challenges is “.. to propose the development of an application that links and uses open datasets […] to find suitable new approaches and solutions to help Europe achieve important goals set by the European Commission through the use of open data.”
Where to find us: - dataobservatory-eu is our private repo collection and private github collaboration platform, but many of our repos are open. Like this one.
Creative Data Observatories LinkedIn Page. Make sure you follow us, and spread our messages.
twitter.com/dataandlyrics is our twitter handle for our music-oriented blog. If you are on twitter, please follow us, and retweet our blogposts.
keybase.io/team/reprexcommunity is our landing page to our otherwise private and invisible internal communication platform. (See more in subchapter?? of Tools.)
6.1 Get Inspired
See our first curatorial interviews:
- Economy Data Observatory: New Indicators for Computational Antitrust
- Digital Music Observatory: New Indicators for Royalty Pricing and Music Antitrust
6.1.1 Create New Datasets
Our mission is to create standardized data about a social, economic, or environmental process that does not have standardized, well-processed open data. To be a data curator, you must have a passion for a topic where evidence is hard to find, and you must have the knowledge to assess that the evidence we find in hidden data sources is valid or not.
- This Scientist Stung Himself With Dozens Of Insects Because No One Else Would: The Schmidt Pain Index, as its informally known, runs from 1-4. The common honey bee serves as its anchor point, a solid 2. At the top end of the scale lie the bullet ant and the tarantula hawk (which is neither a tarantula nor a hawk; it’s a wasp). Watch the video with Dr. Schmidt, and listen to the whole interview here.
- Big Data Is Saving This Little Bird “We need to improve conservation by improving wildlife monitoring. Counting plants and animals is really tricky business.”
6.1.2 Remain Critical
Sometimes we put our hands on data that looks like a unique starting point to create a new indicator. But our indicator will be flawed if the original dataset is flawed. And it can be flawed in many ways, most likely that some important aspect of the information was omitted, or the data is autoselected, for example, under-sampling women, people of color, or observations from small or less developed countries.
Cathy O’Neil: Weapons of math destruction, which O’Neil are mathematical models or algorithms that claim to quantify important traits: teacher quality, recidivism risk, creditworthiness but have harmful outcomes and often reinforce inequality, keeping the poor poor and the rich rich. They have three things in common: opacity, scale, and damage. https://blogs.scientificamerican.com/roots-of-unity/review-weapons-of-math-destruction/](https://blogs.scientificamerican.com/roots-of-unity/review-weapons-of-math-destruction/)
Catherine D’Ignazio and Lauren F. Klein: Data Feminism. This is a much celebrated book, and with a good reason. It views AI and data problems with a feminist point of view, but the examples and the toolbox can be easily imagined for small-country biases, racial, ethnic, or small enterprise problems. A very good introduction to the injustice of big data and the fight for a fairer use of data, and how bad data collection practices through garbage in garbage out lead to misleading information, or even misinformation.
Why The Bronx Burned. Between 1970 and 1980, seven census tracts in the Bronx lost more than 97 percent of their buildings to fire and abandonment. In his book The Fires, Joe Flood lays the blame on misguided “best and brightest” effort by New York City to increase government efficiency. With the help of the Rand Corp., the city tried to measure fire response times, identify redundancies in service, and close or re-allocate fire stations accordingly. What resulted, though, was a perfect storm of bad data: The methodology was flawed, the analysis was rife with biases, and the results were interpreted in a way that stacked the deck against poorer neighborhoods. The slower response times allowed smaller fires to rage uncontrolled in the city’s most vulnerable communities. Listen to the podcast here
Bad Incentives Are Blocking Better Science “There’s a difference between an answer and a result. But all the incentives are pointing toward telling you that as soon as you get a result, you stop.” After the deluge of retractions, the stories of fraudsters, the false positives, and the high-profile failures to replicate landmark studies, some people have begun to ask: “Is science broken?” Listen to the pdocast Science is Hard here
In Algorithms of Oppression, Safiya Umoja Noble challenges the idea that search engines like Google offer an equal playing field for all forms of ideas, identities, and activities. Data discrimination is a real social problem; Noble argues that the combination of private interests in promoting certain sites, along with the monopoly status of a relatively small number of Internet search engines, leads to a biased set of search algorithms that privilege whiteness and discriminate against people of color, specifically women of color.
Christopher Ingraham wrote a quick blog post for The Washington Post about an obscure USDA data set called the
natural amenities index, which attempts to quantify the natural beauty of different parts of the country. He described the rankings, noted the counties at the top and bottom, hit publish and did not think much of it. Almost immediately he started to hear from the residents of northern Minnesota, who were not very happy that Chris had written, “the absolute worst place to live in America is (drumroll, please) … Red Lake County, Minn.” He could not have been more wrong … a year later he moved to Red Lake County with his family.
6.1.3 Your First Data Contribution
Your first contribution can be made without writing a single program code –- but if you are experienced in reproducible science, then you can also submit a code that creates your data.
Make sure that you read the Contributors Covenant. You must make this pledge to make participation in our community a harassment-free experience for everyone, regardless of age, body size, visible or invisible disability, ethnicity, sex characteristics, gender identity and expression, level of experience, education, socio-economic status, nationality, personal appearance, race, caste, color, religion, or sexual identity and orientation. Participating in our data observatories requires everybody to act and interact in ways that contribute to an open, welcoming, diverse, inclusive, and healthy community. It is better this way for you and for us!
Send us a plain language document, preferably in any flavor of markdown (See subchapter ?? in the Tools), or even in a clear text email about the indicator. What should the indicator be used for, how it should be measured, with what frequency, and what could be the open data source to acquire the observations. Experienced data scientists can send us a Jupiter Notebook or an Rmarkdown file with code, but this submission can be a simple plain language document without numbers.
Make sure that you have and ORCiD ID. This is a standard identification for scientific publications. We need your numeric ORCiD ID.
Make sure that you have a Zenodo account which is connected to your ORCiD ID. This enables you to publish data under your name. If you curate data for our observatories, you will be the indicator’s first author, and depending on what processes help you, the author of the (scientific) code that helps you calculate the values will be your co-author.
Please, follow us on social media, it really helps us finding new users and showing that we are able to grow our ecosystem.
Green Deal Data Observatory on Linkedin and Green Deal Data Observatory on Twitter
Economy Data Observatory on Linkedin and Economy Data Observatory on Twitter
Digital Music Data Observatory on Linkedin and Digital Music Data Observatory on Twitter
- Please send us back this md file with your data. You can open it with any text editor, but Notepad, TextEdit, Vim and similar clean text editors are the best.
You can stop here if you do not have programming experience. If you do, please go on with the next steps:
Without programming experience your first indicator should be uploaded manually to Zenodo, and we will help automating the new versions. This will mean, for example, the upload of a simple, csv version of an Excel table, and filling in some important information about the contents of the table.
With some level of R or Python programming experience, we ask you to create a Github repo where you store your indicator. We will help you with tutorials, program codes, or applications to automate your data publication on Zenodo. In this case, make sure that you also have a Sandbox Zenodo account. There is no undo button on Zenodo. If you are tinkering with automatically publishing data, practice first in the sandbox, which is a practicing clone of Zenodo with undo button. (To avoid accidents, you need to have a completely different account with different credential on the real and the sandbox practice repository.)
Experienced programmers are welcome to participate in our developer team, and become contributors, or eventually co-authors of the (scientific) software codes that we make to continuously improve our data observatories. All our data code is open source. At this level, you are expected to be able to raise and/or pick up and solve an issue in our observatory’s Github repository, or its connecting statistical repositories.
Our data is mainly processed in R language software, and sometimes in Python language software. If you are experienced with R bookdown, R Shiny or working in the hugo language, then you are welcome to join our developer team in non-curatorial roles.
6.2 Indicator Design
We are committing ourselves in the final deliverable to follow the indicator design principles set out by Eurostat: (Eurostat 2014, 2014; Kotzeva et al. 2017) to create high-quality, validated indicators that receive appropriate feedback from users, i.e. music businesses, their trade associations and policy-makers.
What are the characteristics of a good indicator? Based on the above-mentioned Eurostat expectation, we formulated it for our observatories in this way.
Relevance: Indicators must ‘meet the users’ needs’; if they do not measure anything useful to policymakers, the public or researchers, they will probably not be widely used. Indicators should also be unambiguous in showing which direction is ‘desirable.’Accuracy and reliability: Indicators must ‘accurately and reliably portray reality’; an inaccurate indicator can lead to erroneous conclusions, steer the business or policy making process in the wrong direction or let negative effects go undetected.Timeliness and punctuality: Indicators must be released at a time that is relevant to the end user. If we cannot produce an accurate indicator in a timely manner, we should aim to create a leading indicator that is sooner available and with relatively high accuracy correlates with the indicator that is not available on time.Coherence and comparability: Indicators should be ‘consistent internally, over time and comparable between regions and countries. This is particularly relevant for indicators used for policy monitoring and assessment, and in international business planning and assessment.Accessibility and clarity
Examples for indicators in our Digital Music Observatory:
Indicators that were used with all known royalty valuation methods (PwC 2008), for both author’s and neighbouring rights, and fulfill the IFRS fair value standards, incorporated in EU law and the recent EU jurisprudence (InfoCuria 2014, 2017).
Indicators that can be used for calculating damages, or calculating the value of the value gap (Daniel Antal 2019a, 2019c).
Indicators that quantify the development needs of musicians and can set objective granting aims and grant evaluations (Dániel Antal 2015).
Understanding how music is taxed, how music contributes to the local and national GDP, and how music creates jobs directly, indirectly and with induced effects (Daniel Antal 2019b).
Providing detailed comparison of the differences of music audience among countries.
Measuring exporting success on streaming platforms, and preparing better targeting tools.
6.2.1 Creation and Quality Control of Indicators
An indicator values are created if we the data curator has some, preferably at least 20 observation values available in data table that confirms the tidy data principles, i.e. each variable is in exactly one column of the table, and each observation is in one row of the table.
Each indicator should be described in a clear, English language text, describing the meaning of the variables, the source of the observations, and other important information about the processing, refreshing, extending of the dataset.
We are safeguarding the quality of the indicators with various reproducible research methods. Depending on the data scientific level of the curator, we either take over the quality control mechanism, or cooperate with the curator. But the main inputs for quality control should be described by the data curator.
Unit testing: Unit tests are simple, numerical test that avoid logical errors in an indicator. Shall we exclude zero values? Negative values? Do percentages must add up to 100? Some of our indicators go through more than 60 unit tests. We ask your help to get us going, and we will take care of the usual suspects: wrong currency translations, wrong decimal places (thousand, million units), etc.
Missing data treatment: No real life dataset is complete, but many statistical and AI methods cannot handle missing values. Therefore, we make an effort to impute with an estimated value the missing values. Imputation is sometimes self-understanding, but sometimes it is a very tricky business, particularly when the data has several dimensions (particularly time or geographical dimension.) We want to agree with the curator because some data may be missing, and how best to handle it. For simple, two dimensional datasets, by default, we use linear approximation, forecasting and backcasting of the values, and in small datasets the last observation carry forward or the next observation carry backwards methods. May compromise the data? Let us know.
Testing against peer-reviewed results: Often we know that after making various computations with a data, we must achieve an already known value. For example, the various components of the GDP in economics must add up with a pre-defined precision. Certain inputs must match a scientifically valid result. If you know of such tests, let us know, and let us include them in the unit-testing processes.
Peer-reviewed data manipulation code: Whenever we re-organize, impute, or otherwise change the original data, we do it only with algorithms that went through scientific peer-review as algorithms. If there is a bug or something to improve in the way we handle the data, our code transparency makes it likely to come out.
Peer-reviewed data application: We encourage our curators, particularly academics, to send the indicators created with the help of our research automation to various forms of scientific peer review, to make sure that the data is valid, useful… and to bring credits to the curators.
Authentic copies: We are placing each new version of the indicators values into Zenodo, a data repository that keeps authentic copies, versions, and assigns them digital object identifiers (DOIs). This makes sure that whenever our curators’ data is re-used, and incorrectly manipulated by a business, scientific or policy user, we can detect such manipulation.
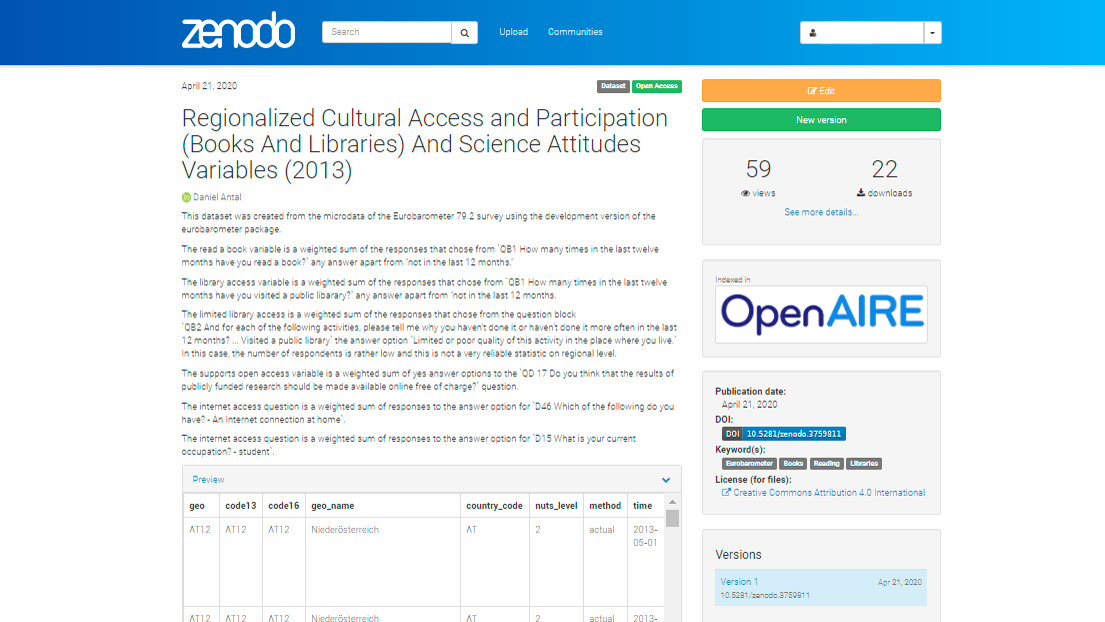
Figure 6.1: Zenodo Deposition Example
You can see this dataset here, which was used in this high-profile scientific publication.
6.3 Authentic Depositions of Indicators
We designed a workflow that helps our curators to put their indicator tables to Zenodo. In many cases, particularly if they do EU-funded research, this is also usually a grant requirement. At the same time, we place the indicator to our database, and make it available on our data observatory’s API.
With low-frequency data, such as annual data tables, we place all copies to Zenodo first, and then to the data API. In these cases, each new version of the indicator values (containing a new year, a new estimation, or a new country, a new observation unit) will have a new DOI version.
With high-frequency data, such as data tables that are refreshing daily or several times a day, we do not think that authentic versioning is useful. In such cases, we create an authentic version at a pre-agreed time frequency, for example, monthly.
6.3.1 How to Add your Existing Zenodo Depositions to Our Observatory
If you have a relevant dataset on Zenodo that should be featured in one of our observatories, or you are just uploading a new dataset, you should send it to our observatory communities. Communities are just collections that make your data easier to find and cite.
On your new or existing deposition, go to Edit, and you will find Communities right after Files and above Upload Type.
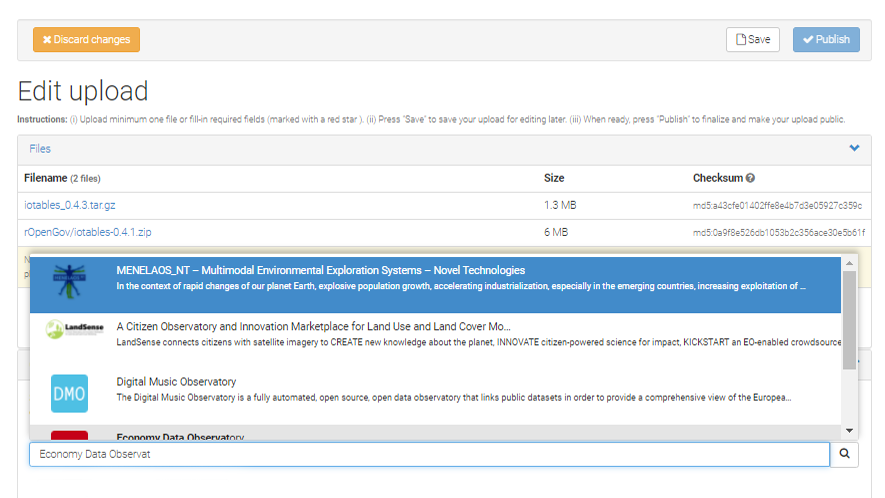
Figure 6.2: How to Add your Existing Zenodo Depositions to Our Observatory?
If you want to be featured regularly in our observatories, your data should conform our database schema. In this case, we will help you maintaining the timeliness of your data – basically we will together keep your dataset growing, expanding, and be available via our API, too. (See an example here. We will add a tutorial on this shortly to our blog.)
6.3.1.1 Digital Music Observatory
You can deposit your data, or search for new, exciting data on Zenodo itself to our music observatory on zenodo.org/communities/music_observatory.
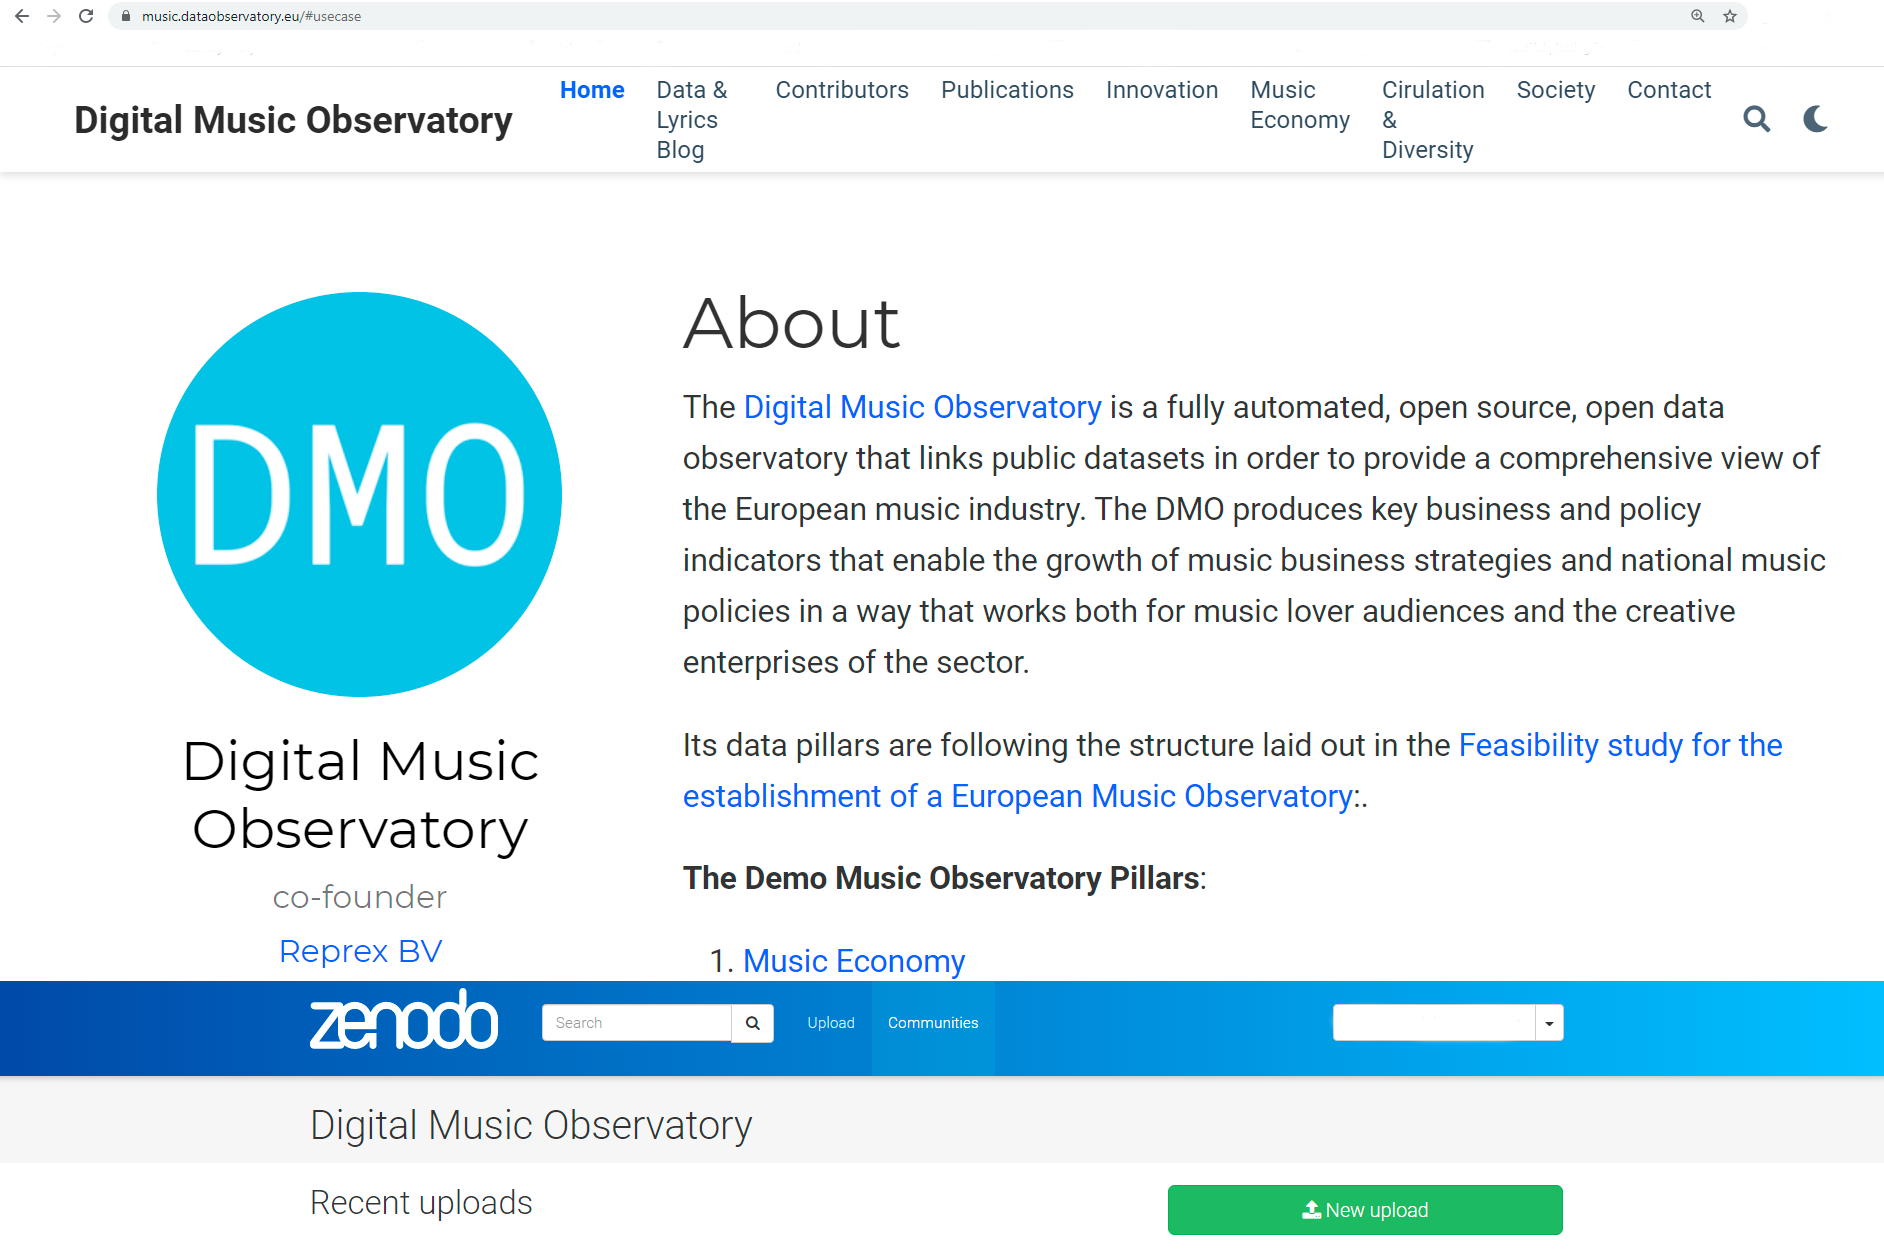
Figure 6.3: Deposit Data, Curate Data on Zenodo for the Digital Music Observatory