CCI Industry Documentation
2021-09-20
Executive Summary
Our aim is to identify existing data sources, and re-process and integrate data from them into a continous data processing and integration system, the CCI Observatory.
The proposed research strategy of this document is the following. 1. Bring together before 7 October into a single, skeleton CCI Data Observatory all relevant data that is already known about CCIs and innovation.
Explain why it is very likely that these data sources, already used in some similar studies, are likely to be extremely biased, in some cases, up to the point of being misleading.
Design a data re-purpoposing (PSI, open science) and data collection (with clear focus, well-stratified) to correct these biases in some countries and some industries, and present these novel results.
Project back what we have learned from the new, well-sampled, well-designed data to the pre-existing and extremely skewed, biased data, and generalize the findings, for example, earlier studies may have underestimated the employment effect by X because of Y. Spillovers may have been reported like Z, but our study shows that their geographical characteristics are more like W.
Two general comments.
Data costs can take many forms, they can be insourced or outsourced. If the Consortium has survey specialists, people familiar with disseminating surveys, or data scientists who know how to write code to access novel open science or open governmental sources, we have less external cost. If such personnel are not available for a WP, then the cost must be budgeted as outsourcing cost. As a price indication, a well-desigend national questionnaire cannot cost less than 30,000 as a primary data source. Any new feature that requires the extension of existing Reprex software usually requires several hundred very senior data scientists hours. These can be bought at market rates, or via our academic data science partners mainly in rOpenGov/rOpenSci at the University of Turku.
The Consortium members do not use a consistent terminology of data mapping and CCIs. Europeana uses the ‘cultural industries’ term from a KEA study that found its way to the Green Paper, but it is not compatible with the original UK policy concept and the CCI concept used by Eurostat. However, you group CCIs, the cultural industries term as used by KEA and Europeana is a very small part of them, mainly the cultural heritage sector, which is mainly not an industry (in the terms of business enterprises.) It is only about 10-15% of the CCIs as defined by ESSNet Culture, a working group set up by the European Council to define CCIs and find out about data availability. They have also created a very extensive data mapping. This means that if we say that we have dissemination capacity in the ‘cultural industries’ but not in creative, our dissemination capacity (which can also be used for primary data collection) do not cover about 85% of the task and covers the 15% where most forms of innovation are not present because these are non-profit organisations. They also have very different data sources, so that part of the CCIs must be measured with different data coming from different data sources.
Problem Statement
The problems with CCI are related to three important causes.
The most important is the lack of large and medium sized businesses, and the dominance of microenterprises. These enterprises file simplified tax returns and financial statements–-which are the data sources of value added. They are also exempted from almost all statistical data gathering, including innovation due to their size.
They usually employ up to 2 people, and the main form of employment is atypical, freelance, which is not well represented in employment-based data collection.
The CCIs are parts of larger NACE classification groups, so no statistics are made for music, film, design, etc.
In our view, there is no data available in existing data sources that is both comprehensive (contains many European countries and industries) and representative (of the given industry such as music, design, or books.)
Collect, Integrate, Present Existing Data
The CCI Observatory will collect, process, clean all existing, relevant CCI data from existing statistical sourcees (see Inital Data Observatory). This data is extremely limited from an innovation point of view, but can be a very good starting point to explain the need of our research.
We will use the definition of cultural and creative industries as outlined in the Cultural and creative industries from a statistical point of view of the ESSnet-Culture Final Report(Bína, Vladimir et al. 2012) which is an EU compromise among earlier conceptual frameworks names as the Creative industries approach, the Copyright industries approach, the Experience economy approach and the Sector approach for cultural industries or sector specific studies.
This approach is only slightly different from the Green Paper (essentially the KEA study) mentioned in the call, which lumps together the business enterprise sector and the mainly governmental or non-profit sector in cultural heritage as part of the cultural industry. From a statistical point of view, the Green Paper definition is impractical, because the business enterprise sector is described with different statistical indicators than the governmental sector. The more precise ESSnet/Eurostat definition will not cause a friction with the call, just will make data mapping clearer.
In international comparison, the European statistical view is somewhat different from the UNESCO view, which considers sports and recreation and tourism, too. Existing statistical sources do not contain data about CCIs, but contain data about NACE classes that mainly contain information about CCIs. Using the mapping provided by ESSnet-Culture we will provide data about NACE classes (“sectors” of the economic statistics).
business demography of mainly CCI NACE classes, and business demography of innovative firms (that perform R&D or innovation activities), and knowledge flow data.
Gross value added of mainly CCI NACE classes vs other classes.
employment and related wage, tax information about mainly CCI NACE classes
indicators of forward and backward linkages (channels of potential spillovers) of mainly CCI NACE classes in comparison with non-CCI classes
GVA, employment direct, indirect, and multipliers for mainly CCI NACE classes.
BERD (business enterprise R&D spending) for mainly CCI NACE classes, in comparison with non CCI, too.
R&D personnel for mainly CCI NACE classes, in comparison with non CCI, too.
While we can place an impressive amount of indicators into our CCI observatory within 2 weeks, we must make it clear that this is more the part of the problem statement than the solution. If any data is published by Eurostat (particularly from CIS) about CCIs, it should be used as a very imperfect, even misleading starting point that should be improved before analysis.
Open Data: Repurposing Exsiting Data
Reprex’s main know-how is to create data pipeline, standardized unit tests and other data science methods to re-purpose, correctly join, document and disseminate statistical indicators from non-statistical but reliable sources. The Observatory will re-process them into tidy formats that allow to integrate or repurpose the data, and provide DataCite, Dublin Core and statistical metadata for reuse. This service is ongoing, and as new data enters the pipeline, the indicators, tables, descriptions will refresh. This meets Horizon Europe’s open science needs, furthermore, it ensures the long-term reusability of the data brought up by Reprex.
For this approach to work, we would like to call each Consortium member to assing a data curator to the observatory, because repurposing scientific or governmental open data requires domain-specifict content knowledge. In other words, in order to bring up data from these sources, the researchers of the WPs should be able define precisely their data needs and qualitatively judge Reprex’s supply (Reprex will do all the quantiative checks.) Does the indicator proposed by Reflex meets the research needs of a specific task in a WP?
- Re-purposing open science data from the previous works of the Consortium. We should prioritize this, because it can be added to highlight the past references of the Consortium, and take stock of what we have. This should be done before the evaluators read the grant proposal to increase the credibility, and preferably, before finalizing the call, because in this case, existing data and research can be refered in footnotes with separate DOIs. (Our observatroy will create an authoritative copy of all data with a DOI and refernece to the original creator(s).)
Researchers should send their data from previous, but relevant research history in CSV, Excel, SPSS or any likely machine readable format, or, as a very last resource, in PDF with citation information. We will place them into the observatory in tidy format and correct metadata. This will also help us to gather more, similar data from open science.
Re-purposing open science data from other researchers: with the help fo the Consortium’s experienced researchers, we will identifies existing open scientific work which has data published in open repositories. [It would be very good to identify a few in the coming days.]
Re-purposing PSI data: with the help of the Consortium’s experienced researchers, we will identify existing but not exploited governmental data sources and build data pipelines to retrieve, test, process the data into reliable indicators. Reprex’s has very in-depth know-how here, and this area is usually not well known by researchers, because it requires an understanding of the work processes of the creation side of governmental statistics and internal indicators, such as data collections of tax authorities. We are likely to turn with data requests to EUIPO, EPO, and potentially case study countries’ tax authorities. There is only one such source that we can rely on before 7 October, the innovation aspects of the Eurobarometer Survey.
Data sharing with industry: technically similar to PSI, but on a voluntary basis. We hope to repurpose data from GESAC, CISAC, national cultural industry federations, etc. We can particularly point out to such data sources in music, film, and to some extent in books.
We can add data from CEEMID’s history to show that we have experience in CCI data collection and in the Design New Data Collection To Complement Existing Data. These data wil only be partly related to innovation.
Design New Data Collection To Complement Existing Data
The main methodological guide to collecting innovation data is the Oslo Manual 2018 Guidelines for Collecting, Reporting and Using Data on Innovation, 4th Edition which is used both by the EU and the OECD.
The Oslo Manual recognizes the usefulness of Data Linkage, a practice when pre-existing and public data can be augmented with data collected from the entities. For example, public company financial reports can be extended with questionnaires sent to the companies whose public financial reports are available. While innovation surveys target legal persons with at least ten employees who usually have sufficient public data available, most CCIs are not legal persons, or legal persons below the treshold of releasing significant amount of data. The Consortium’s legal experts will identify data sources where such linkage is possible (public data about music works? patents?)
We have significant expertise in ex post survey harmonization, when we are repurposing data from other surveys not intended to be used in a CCI and innovation context. Ex post harmonization creates new datasets, indicators from pre-existing data.
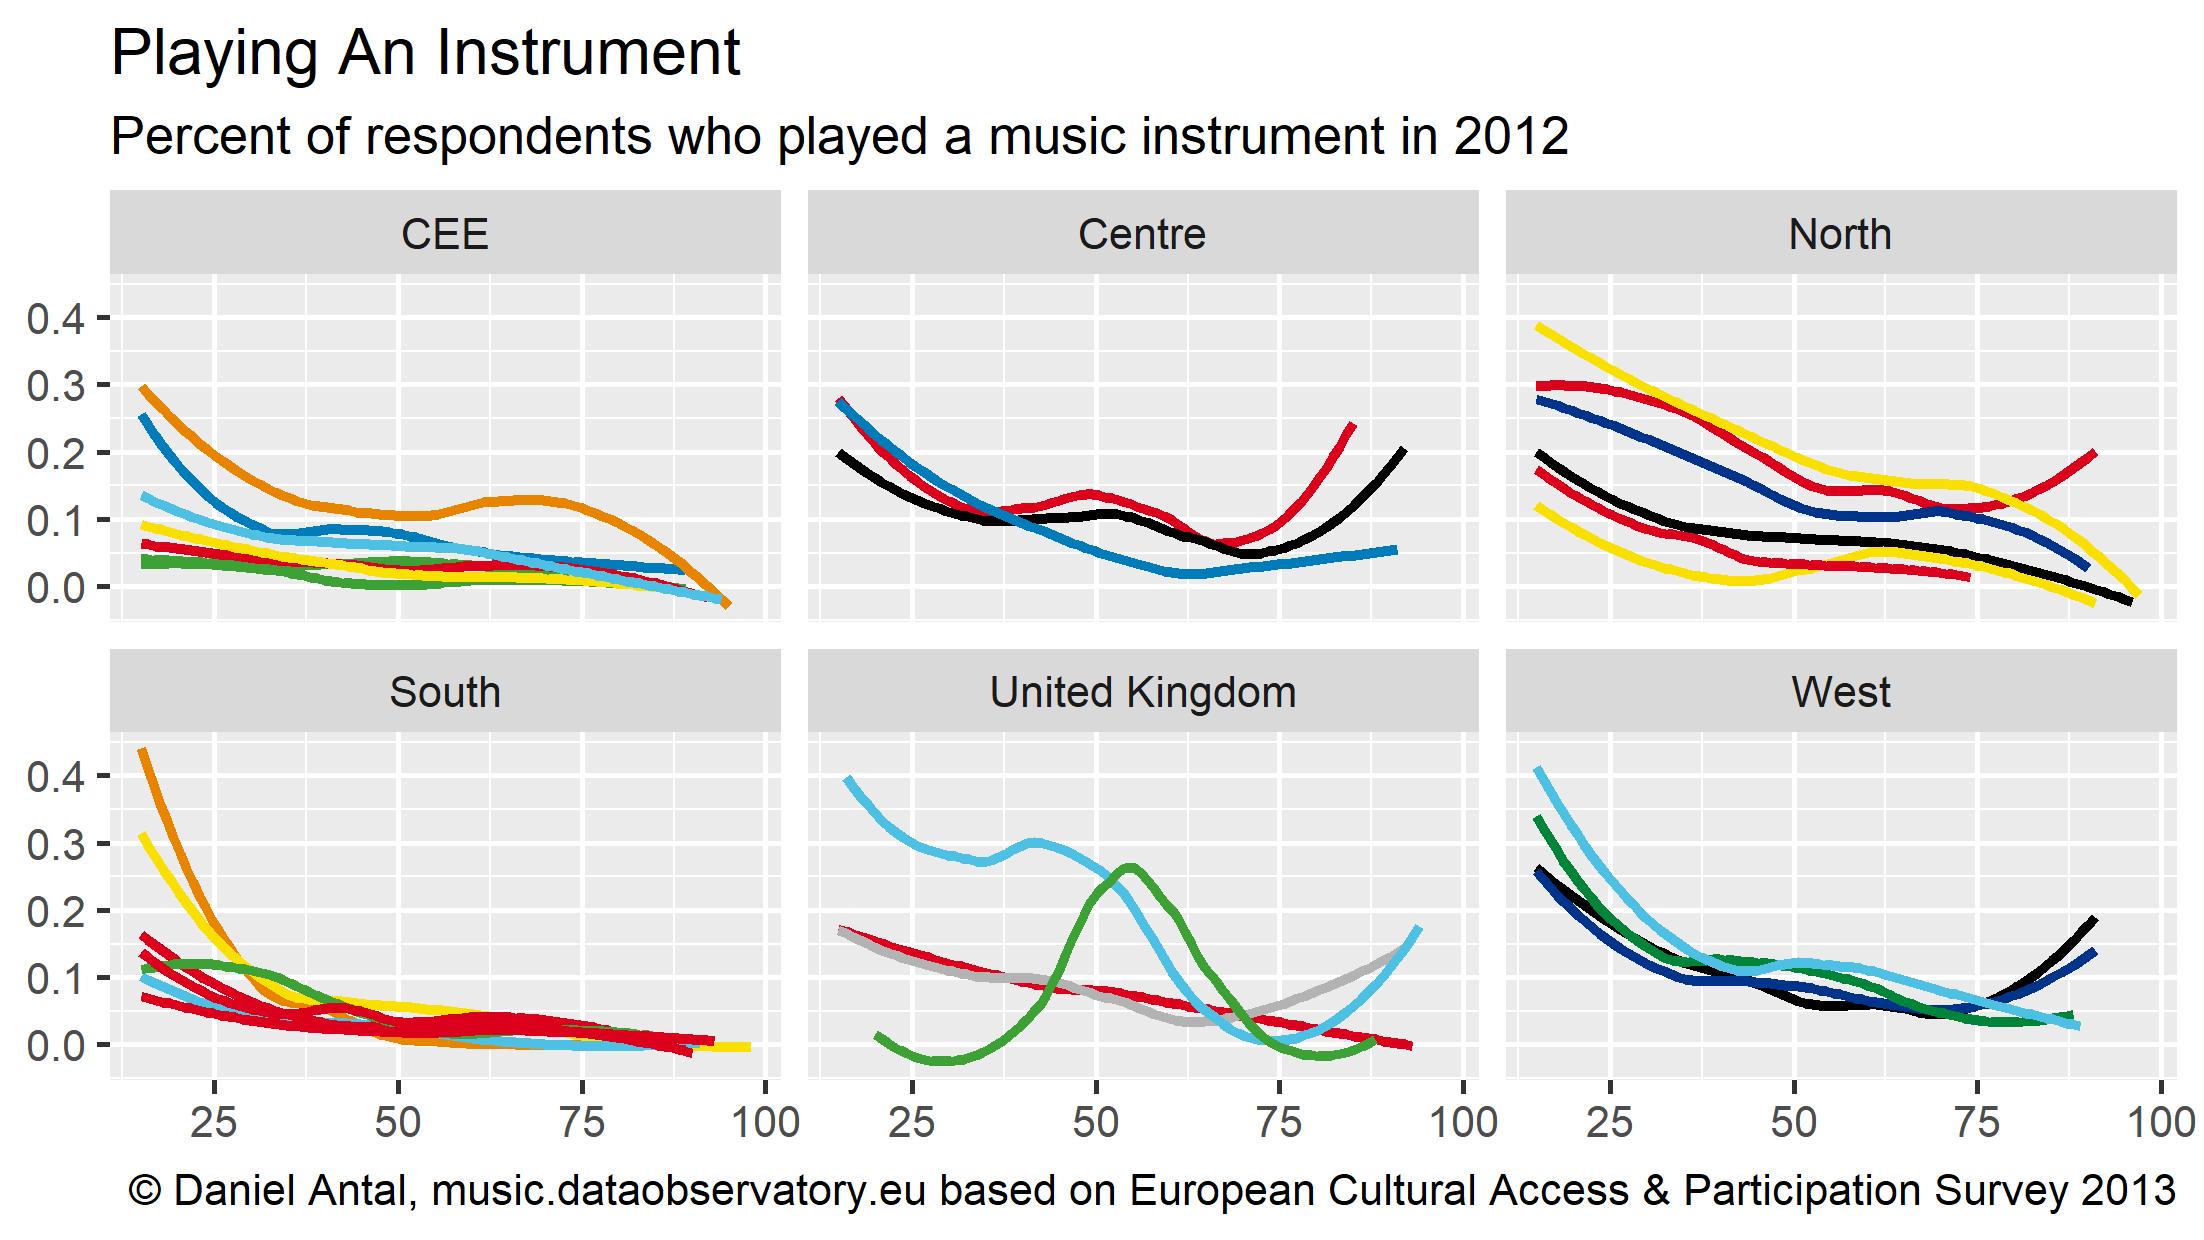
Figure 0.1: Ex post harmonized data about cultural access and participation for the develoved governments of the UK.
- Ex ante survey harmonization means designing similar surveys for example to the CIS enterprise surveys for microenterprises in music or design. This is an approach to which we will show a few examples from the previous CEEMID surveys—we believe that this should be treated as the primary source of data for Consortium’s planned research activities. The Oslo Manual is rather silent on this technique, and only states that it has been demonstrated to be possible and refers to Defining and measuring innovation in all sectors of the economy by Fred Gault (Gault 2018).
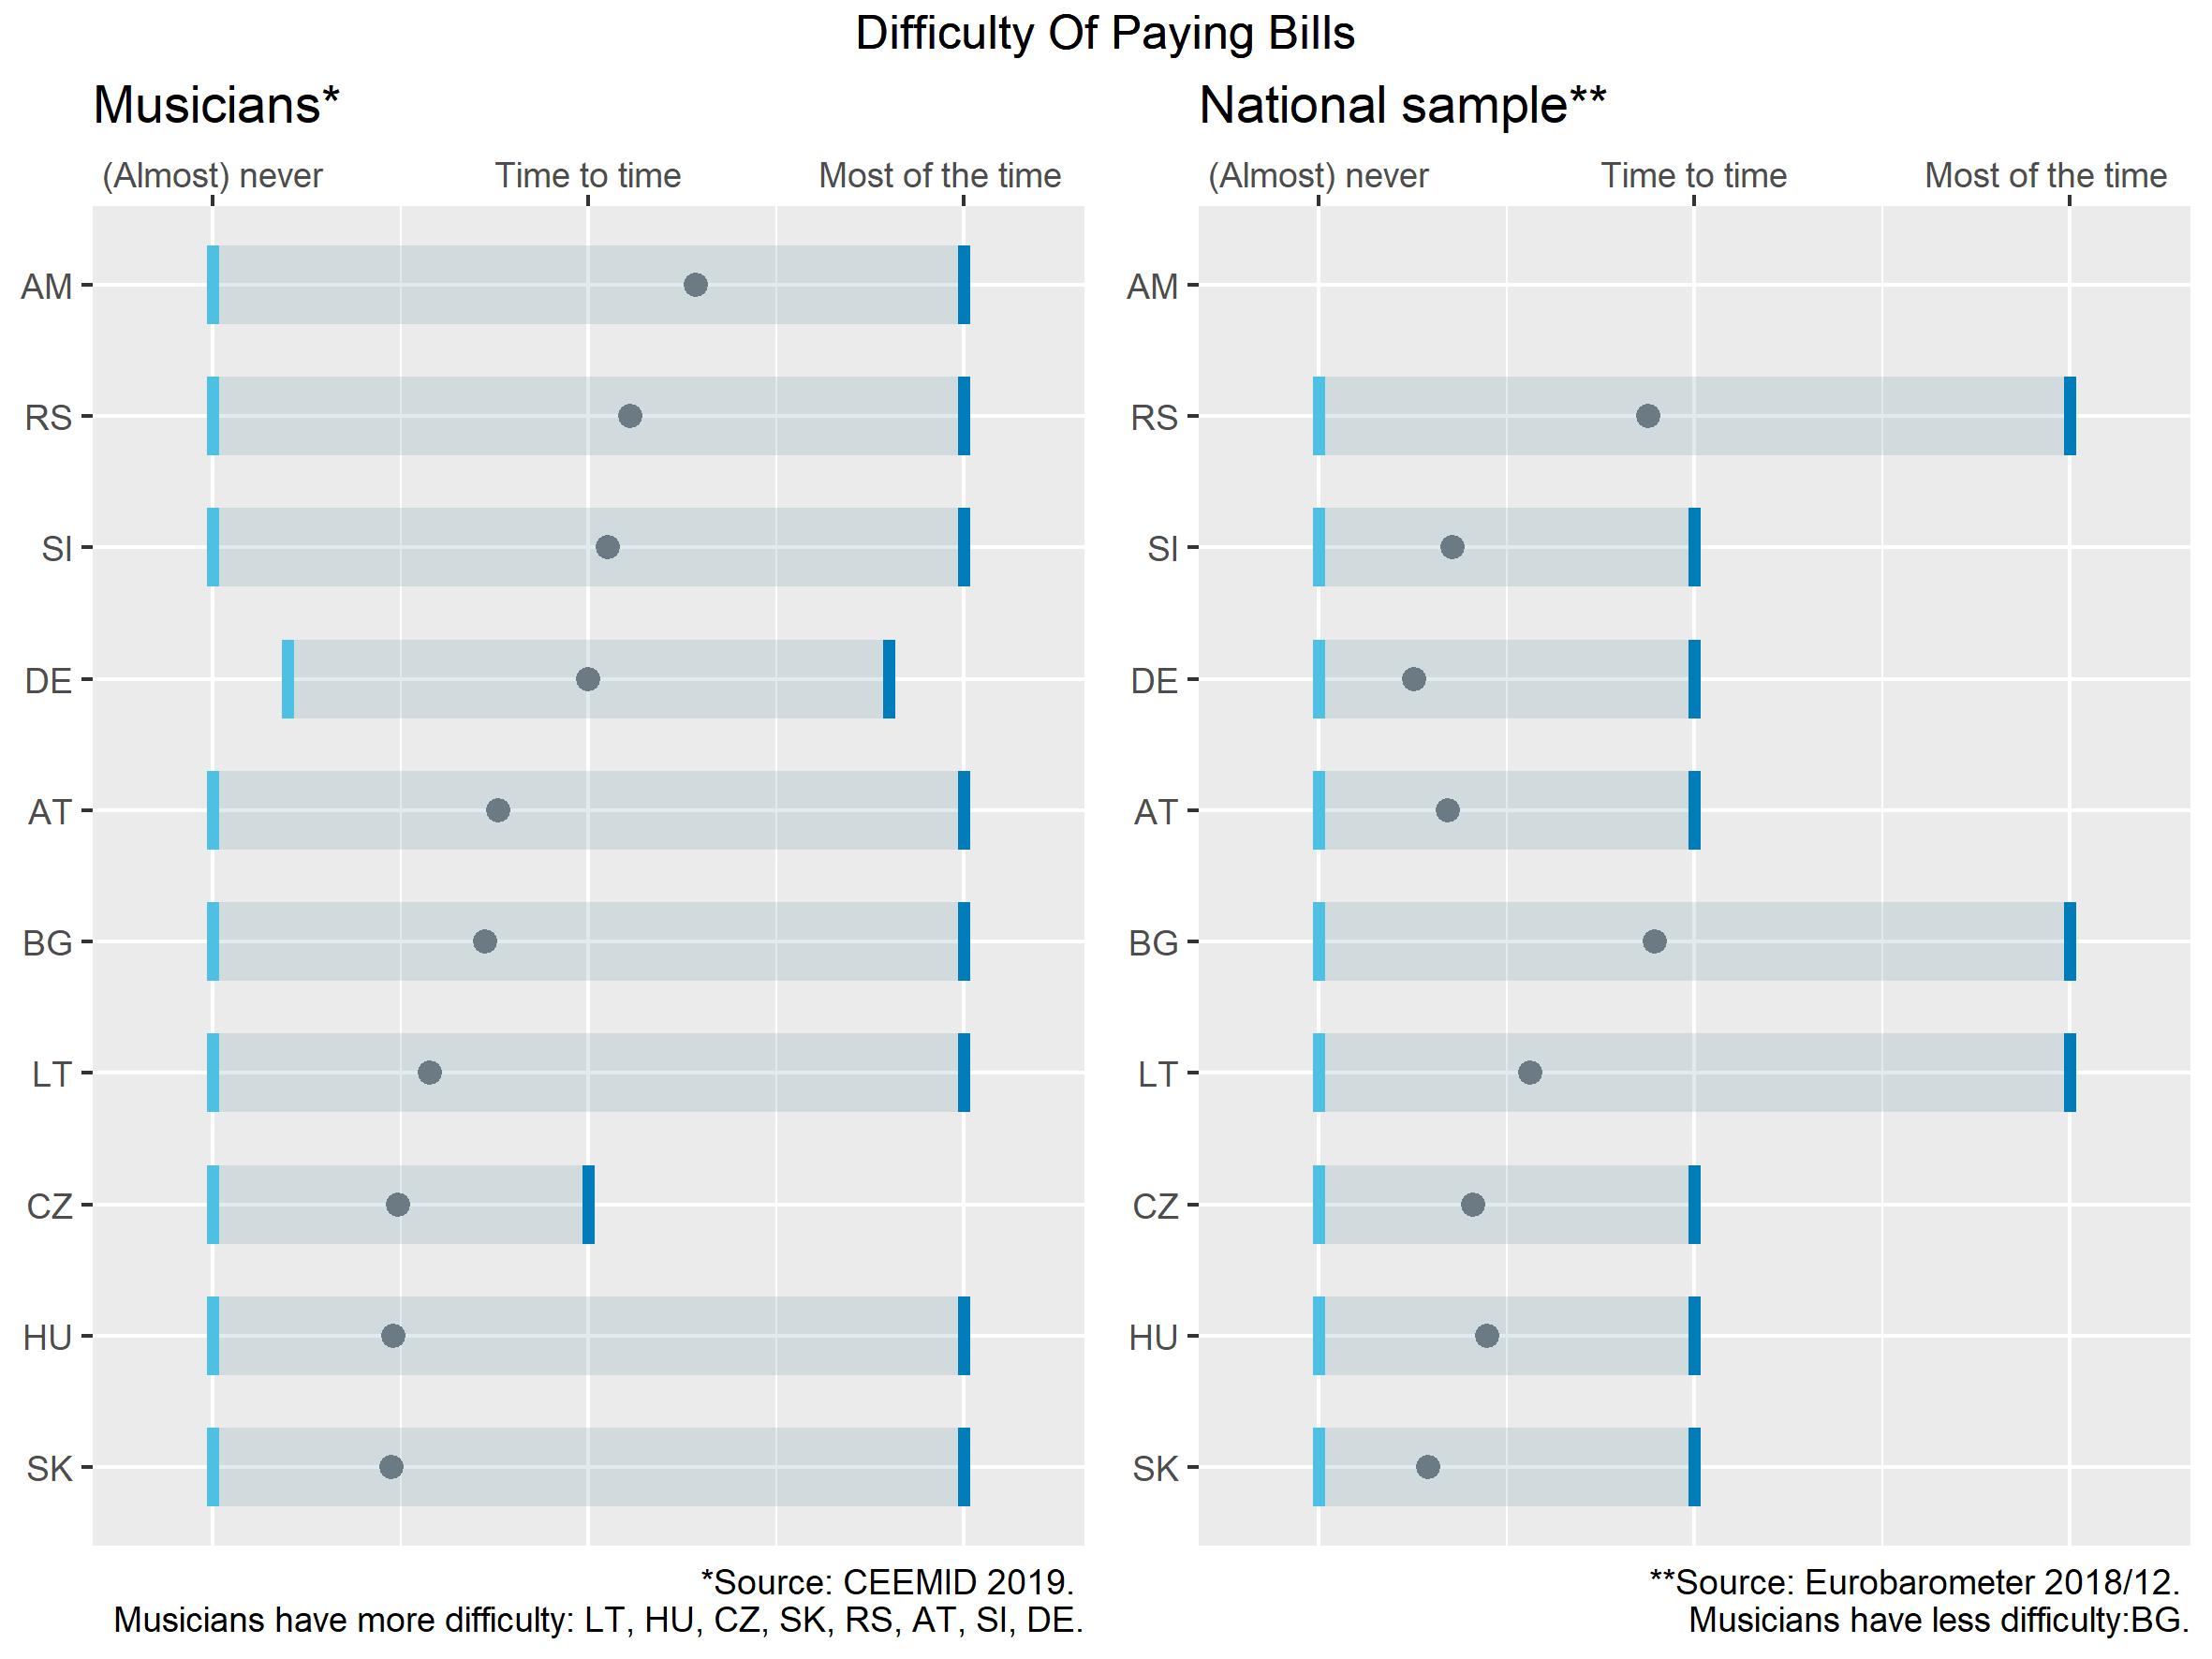
Figure 0.2: Ex ante harmonized data about the relative poverty level of musicians vs the general population.
We can also use the nationally representative music professional and film professional surveys from CEEMID as use cases and show a few indicators that may be replicated in a Pan-European manner.